In the volatile world of crypto, Bitcoin $68K support is emerging as a critical battleground, especially as gold teeters near its key $5K level. Analysts are eyeing this dynamic with keen interest, noting how traditional safe-haven assets like gold are losing ground while Bitcoin holds firm. This isn’t just another price wiggle; it’s a telltale sign of shifting investor sentiment in uncertain times.
With geopolitical tensions simmering and markets jittery, understanding Bitcoin $68K support requires looking beyond the charts to broader economic cues. Gold’s slip from $5K underscores a potential rotation back to digital assets, but is it sustainable or just another head fake? Let’s dissect the data and cut through the noise.
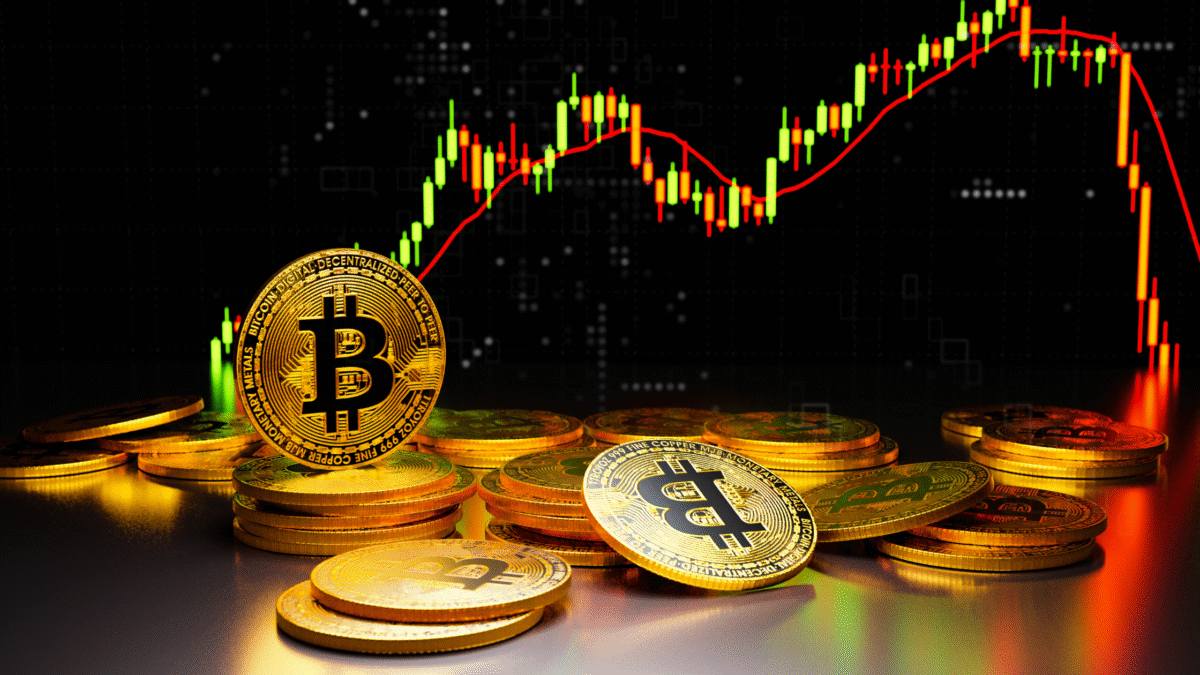
Bitcoin’s $68K Support Under the Microscope
The Bitcoin $68K support level has traders on edge, acting as a psychological and technical floor that’s held through recent dips. This isn’t arbitrary; it’s backed by historical price action where Bitcoin has bounced multiple times from this zone during corrections. As gold falters at $5K, Bitcoin’s resilience highlights a decoupling from traditional commodities, prompting questions about its safe-haven status.
Volume profiles show accumulation by large holders at this level, suggesting smart money sees value here. Yet, with macro pressures like interest rate whispers and regulatory shadows, holding this support demands more than hope. Context from recent market moves, including Bitcoin decline analysis, reveals patterns that could either reinforce or shatter this floor.
Diving deeper, on-chain metrics paint a bullish picture beneath the surface volatility. Long-term holders aren’t flinching, adding to their stacks amid the pullback.
Technical Indicators Backing the Hold
Key moving averages converge around Bitcoin $68K support, with the 200-day EMA providing a sturdy base. RSI readings hover in neutral territory, avoiding overbought pitfalls that plagued prior rallies. This setup echoes 2024’s consolidation phases, where similar supports launched multi-month uptrends.
However, Fibonacci retracements from the last cycle high align precisely here, adding confluence. Traders watching for a breakout above $70K see this as the springboard, but failure could cascade to lower supports. Cross-referencing with Bitcoin $70K resistance analysis sharpens the outlook.
Volume delta confirms buying pressure dominates at $68K, with spot demand outpacing futures liquidation cascades. This isn’t retail FOMO; it’s institutional layering.
On-Chain Data Signals Accumulation
Wallet cohorts show ‘old hands’ scooping up Bitcoin at Bitcoin $68K support, mirroring patterns from past bear phases. Exchange inflows have tapered, reducing sell pressure, while self-custody transfers spike. Metrics like MVRV Z-score indicate undervaluation relative to realized price.
Coin days destroyed remain low, a hallmark of HODLing rather than distribution. When paired with Bitcoin accumulation trends, it suggests the dip is a loading zone for the next leg up. Skeptics point to whale movements, but net flows favor bulls.
Stablecoin inflows to exchanges hit yearly highs, priming liquidity for a potential rebound if support holds.
Gold’s $5K Slip: A Gift to Bitcoin?
Gold’s retreat from the pivotal $5K mark is no small affair, especially as it coincides with Bitcoin $68K support testing. Traditionally, gold shines in turmoil, but its slip hints at fatigue among safe-haven seekers. This divergence could funnel capital toward Bitcoin, accelerating the narrative of digital gold.
Central bank buying has propped gold lately, but retail disillusionment is evident in ETF outflows. With inflation cooling and yields rising, gold’s allure dims, spotlighting Bitcoin’s scarcity narrative. Linking to gold rallies vs Bitcoin provides crucial context.
Correlation metrics between the two have decoupled sharply, a bullish sign for BTC maximalists.
Why Gold is Faltering Now
At $5K, gold faces overhead resistance from all-time highs, compounded by dollar strength. COMEX positioning shows speculators overleveraged long, ripe for squeeze. Real yields turning positive erode gold’s edge, as opportunity costs rise for non-yielding assets.
This mirrors 2011’s peak, where euphoria gave way to multi-year slumps. Current COT data echoes that overcrowding, per recent reports. Investors rotating out may eye Bitcoin vs gold debates for alternatives.
Geopolitical de-escalation rumors further deflate gold’s risk premium.
Implications for Crypto Flows
Gold’s weakness at $5K correlates with Bitcoin inflows, as portfolios rebalance. Stablecoin minting accelerates, often preceding BTC bids. This flow dynamic has repeated in prior cycles, bolstering Bitcoin $68K support.
ETFs like GLD see redemptions while BTC ETFs post inflows, a clear arbitrage play. Check Bitcoin safe-haven evolution for deeper insights. Capital velocity from gold to crypto could ignite the next rally.
Macro Factors Influencing the Duel
Beyond charts, macro headwinds like Fed policy and geopolitics frame the Bitcoin $68K support vs gold $5K narrative. Rate cut delays bolster the dollar, pressuring both but hitting gold harder due to its yield-less nature. Election cycles add unpredictability, with pro-crypto rhetoric gaining traction.
Global liquidity metrics, including M2 expansion, favor risk assets long-term. Yet short-term, risk-off moods test resolves. Ties to geopolitical crypto impacts underscore the stakes.
Inflation pass-through from energy shocks plays both ways.
Fed Policy and Liquidity Squeeze
Hawkish Fed dots squeeze liquidity, but QT slowdown hints at relief. Bitcoin thrives on cheap money, while gold suffers in high real yield regimes. Balance sheet runoff caps upside for both, but BTC’s halving scarcity trumps gold’s endless supply.
Forward guidance will be pivotal; dovish pivots could shatter Bitcoin $68K support resistance. Historical parallels from 2022 QT phases inform expectations.
Geopolitical Wildcards
Tensions in the Middle East boost initial flight to quality, favoring gold briefly before Bitcoin catches up. De-escalation sells the headline but buys the BTC dip. Monitor geopolitical Bitcoin effects for real-time shifts.
State actor buying in gold contrasts with institutional BTC adoption.
Trader Sentiment and Positioning
Sentiment around Bitcoin $68K support skews cautiously optimistic, with fear indices easing from extremes. Social volume spikes on support tests, but conviction builds on holds. Gold sentiment sours as $5K fails, per futures open interest.
CFTC data reveals extreme shorts on BTC, a contrarian bullish signal. Retail positioning lags institutions, setting up potential short squeeze.
Retail vs Institutional Divide
Retail panic sells at $68K feed institutional buys, widening the gap. Whale alerts show layering, not dumping. This dynamic, seen in whale buying trends, favors upside.
Options skew tilts call-heavy, pricing in rebound.
Fear and Greed Cycles
Greed index climbing from fear bottoms signals capitulation over. Gold’s greed fades, accelerating rotation. Track Bitcoin sentiment risks for gauges.
What’s Next
If Bitcoin $68K support holds, expect a push toward $75K, fueled by gold’s weakness and macro tailwinds. Breakdown risks a retest of $60K, but on-chain strength mitigates downside. Gold below $5K could spark broader commodity shifts, benefiting BTC.
Watch Fed meetings and geopolitical headlines closely; they hold the keys. Position sizing remains crucial in this high-stakes game. Ultimately, Bitcoin’s narrative as superior money strengthens amid these tests.